This page contains all the details about how lipo batteries are tested and what methodology is used.It is meant for those of you, who want to know exactly what is going on and how values are recorded and analyzed.
Note: You don’t need to read this, if you are only interested in how a certain battery performed.
Testing is split in multiple different steps. This methodology overview will follow the same structure as you are used from the battery review.
Break-in period / Charging
Battery Charger: Junsi iCharger 406 DUO* with USB connection and live-logging into LogView (Refresh rate 0.5 Hz).
Charging profile: Balanced Charge, CC/CV. CV phase ends when max. cell drift is 5 mV.
ISR-tester for break-in: Junsi iCharger 406 DUO*. IR tested after full charge and battery has been heated to reference temperature of around 40 °C.
Discharge: Professional electronic Load Zentro-Elektrik ELA 1500 in constant current mode.
- Discharge cut-off: 3,3 V for lowest cell OR 58° C on any temperature probe.
- Controlled by Amtel Mega µ-Processor*.
- Live-Logging to LogView (Refresh rate 2 Hz)
- Voltage supply control circuit: Zentro-Elektrik 7941 at 12.0V
Interested in charing lipo batteries? Check out our article about parallel charing your flight packs (German).
Load Testing
Constant Load
Electronic Load: Zentro-Elektrik ELA 1500 in external program mode.
- Current follows pattern (see below)
- Discharge cut-off: 3,3 V for lowest cell OR 58° C on any temperature probe.
- Controlled by Amtel Mega µ-Processor.
- Live-Logging to LogView (Refresh rate 2 Hz)
- Used capacity: Calculated based on current.
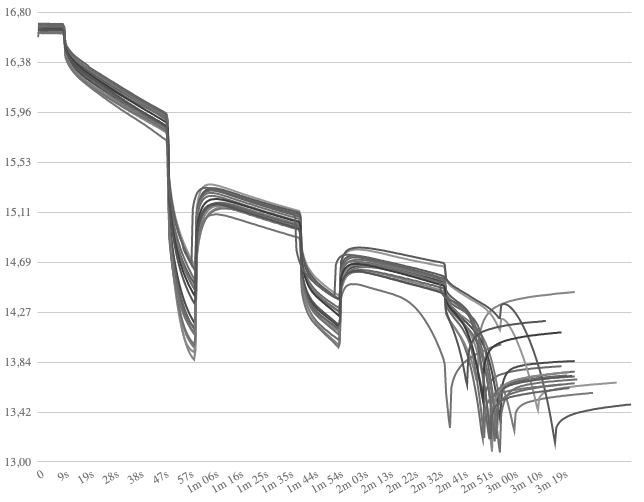
Follows pattern of current pulses that are applied for time intervals >= 10 seconds. Base load is 10 C.
Pattern: 10 sec. : 0C — 40 s : 10 C — 10 s : 50 C — 40 s : 10 C — 15 s : 35 C — 40 s : 10 C — 20 s : 20 C — 40 s : 10 C — 15 s : 30 C — 10 C to end
IR Measurement
Internal resistance is calculated from the constant discharge results. IR is calculated for each cell using formula:

As battery temperature is highly correlated to IR and temperature increases with progressing discharge, IR is calculated for all four current pulses and averaged at the end. The „honest / real“ C-Rating is calculated afterwards. Read all about C-Rating values in our battery guide (German).
Dynamic Load
Electronic Load: Zentro-Elektrik ELA 1500 in external program mode.
- Current follows simulation pattern extracted from real-world telemetry logs.
- Discharge cut-off: 3,3 V for lowest cell OR 58° C on any temperature probe.
- Controlled by Amtel Mega µ-Processor*.
- Live-Logging to LogView (Refresh rate 2 Hz)
- Used capacity: Calculated based on current.
Dynamic load testing is done based on two load patterns derived from real world FPV flights. Pattern 1 is a high speed FPV flight around the open field with an average current of around 22 A. Pattern 2 is a freestyle flight around trees in the park with a lot of high current spikes. Average current on this pattern is around 12 A due to more floating periods after full throttle bursts. Patterns are repeated until one of the cut-off criteria is reached.
Utilized Mini Quad Setups
A big thanks goes out to my buddy, Deepimpact.io in Panama for all the data collecting regarding pattern #2! Check out his videos!
| Pattern 1:
| Pattern 2:
|
Temperature Measurement
Temperature is measured via 3 digital temperature probes (DS1820*). Logging is done aside of all other values like voltages and current. Accuracy of sensors is +/-0.5 °C. Sensors are attached with rubber bands to three different positions on the battery: top, side and near the connection terminal (main power cable).
As this methodology leads to varying data collection points depending on the shape of the battery pack, temperature values should only be understood as a rough guideline, when comparing different batteries.
Test stand design
For the discharge part a self-developed logging solution is utilized to allow to precisely reproduce the testing methodology for each single test run. The core is represented by an Arduino compatible ATMEL MEGA2560 µ-processor*. Cell voltage is measured via a high precision 16 bit ADC (TI ADS1115)*.
Voltage is sampled down by four voltage dividers making use of high precision metal film resistors. The electronic load is programmed via a 0 – 10 V control signal representing 0 – 120 Amps of load current.
As the ATMEL chip only can output PWM signals up to 5 V a PWM-DA-adapter is used to convert the PWM signal into a 0 – 10 V analog control voltage. Current measurement is done by the electronic load itself. Output and logging is realized using LogView. Once the measurement is completed, export to all common spread sheet formats is possible.


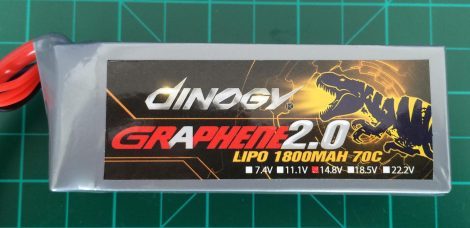

A friend was doing the math about a Masione 16000 22.2v 25C „Designed for the DJI S1000 !“ battery I was using for my S1000, and calculated that, fully-charged, it was giving me the first low-battery warning (set at 22.1 volts) after about 2 minutes of flight time because it was only giving me perhaps 8C discharge and/or it was not really 16000mAh.
But I said „Look at the sticker…it is designed for the DJI S1000!“
He remarked that „Yes, that is the problem with most batteries: The maker just puts any sticker it wants on it. It is just a sticker.“
My faith in my fellow man is shaken and I realize I am a rube, but how in the world can we find a reliable, fast discharge battery for the expensive drones we have, that can use AS150-XT150 plugs that are standard on the S1000?
The friend simply suggested buying 20 of the same brand/model, try them out quickly, and keep the 2 that actually work correctly.
There must be a better way. Ideas, suggestions and rants accepted here… -Peter
Hi Peter,
I am not quite sure what you are trying to find out? Do you want to measure real capacity of your battery or are you trying to find out how much power it can deliver safely?
Cheers!